
I’ve noticed on many customer systems that PGA memory is underutilized. With parameters available since Oracle Database 12c Release 1 (12.1.0.1/2) such as PGA_AGGREGATE_LIMIT, you don’t have to worry as much about exceeding PGA_AGGREGATE_TARGET more than expected and swapping server memory, ending up with a big performance hit and unexpected wait events.
PGA memory is used for many purposes; the largest amounts of PGA per session are things like sorting result sets, hash joins, bitmap merge or create operations, and direct path reads. When operations like these won’t fit into the allocated PGA, the operation is completed using the TEMP tablespace, which at best can be a magnitude slower than if the entire operation fit into server-side memory.
As you might expect, there are two features of Exadata that make these operations even faster.
Testing Scenario
For this example, I have a staging table with approximately 73M rows:
  CREATE TABLE BIG_STAGING_TABLE"
   (	"UC1" NUMBER(16,6) NOT NULL ENABLE,
	"UC2" VARCHAR2(254 BYTE) NOT NULL ENABLE,
	"UC3" DATE,
	"ATTR1" NUMBER(18,0),
	"ATTR2" VARCHAR2(18 BYTE),
	"ATTR3" VARCHAR2(254 BYTE),
	"ATTR4" VARCHAR2(18 BYTE),
	"ATTR5" NUMBER(18,0),
	"ATTR6" NUMBER(38,0),
	"ATTR7" VARCHAR2(25 BYTE),
	"ATTR8" VARCHAR2(254 BYTE)
   ) SEGMENT CREATION IMMEDIATE
 COLUMN STORE COMPRESS FOR QUERY HIGH
;
The logical unique key is composed of the first three columns: UC1, UC2, and UC3. The table is loaded from an external table using SQL*Loader, but instead of relying on a PK constraint and unique index to identify duplicates, the table is loaded “as-is” and a query similar to the following, leveraging ROWIDs, will identify the duplicate rows:
SELECT /*+ PARALLEL(x) */ q.rowid "_ROWID"
FROM
(
  SELECT stg.rowid "_ROWID"
     , ROW_NUMBER() OVER
         (PARTITION BY stg.uc1, stg.uc2, stg.uc3 ORDER BY stg.rowid) "_RN"
  FROM big_staging_table stg
) q
WHERE q."_RN" > 1;
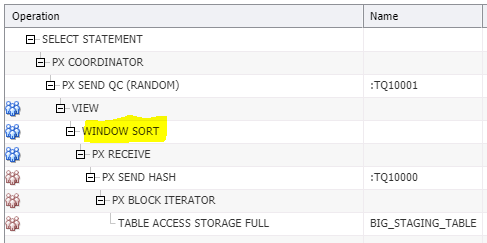
For all of the following examples, the execution plan looks like this, with the key being the WINDOW SORT. The more of it we can do in PGA memory, the better!
Testing Parameters
The tests are simple: run the query with WORKAREA_SIZE_POLICY=AUTO for DOP=1, 4, 8, 12, 16, 20, 24, 28, 32. Re-run the queries with WORKAREA_SIZE_POLICY=MANUAL and SORT_AREA_SIZE=1G.
DOP versus Size (or I/O)
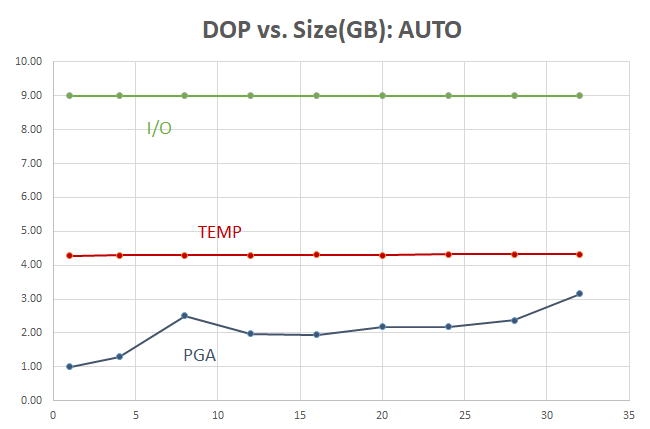
The amount of I/O, when the WINDOW SORT operation spills into the TEMP tablespace, is high but constant. Even when PGA usage increases, most of the activity still happens in the TEMP tablespace:
The resource usage looks much better when setting WORKAREA_SIZE_POLICY=MANUAL:
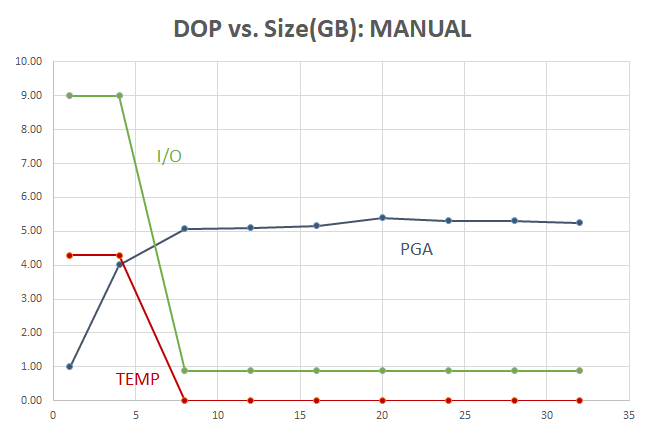
In this Exadata environment, most everything is in flash at the storage layer, including TEMP tablespace segments, but flash is still slower than RAM!
At very low DOPs or with serial execution, most of the I/O required to do the sort is due to the WINDOWS SORT spilling to the TEMP tablespace. When DOP=8 for this query on a table with 73M rows and there’s enough PGA memory for each parallel thread, the sort occurs at memory speed and TEMP is out of the picture.
The amount of PGA levels off at about 5 GB — you may say that you can tolerate using 1-2 GB of PGA, but cannot spare 5 GB of PGA per query — but what if the query runs 8x faster, or more??? Read on.
DOP versus Time
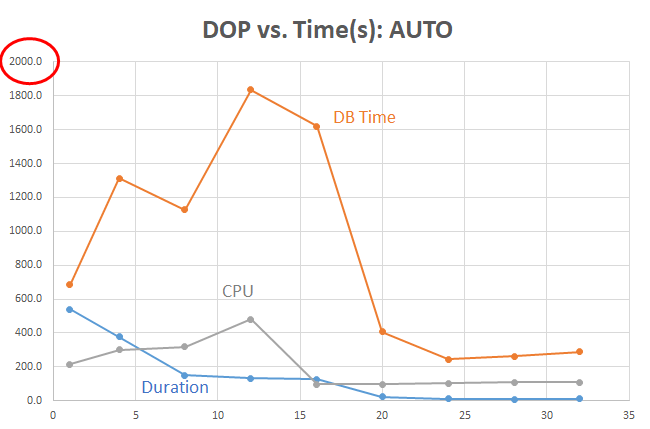
With WORKAREA_SIZE_POLICY=AUTO, the DB Time is high and stays high even at DOP=16. Most of the DB Time is due to TEMP tablespace activity. It’s not until we get to DOP=24 that PGA memory is being leveraged more heavily:
Running the query with more control over the PGA used per session by setting SORT_AREA_SIZE and some reasonable DOP had huge benefits:
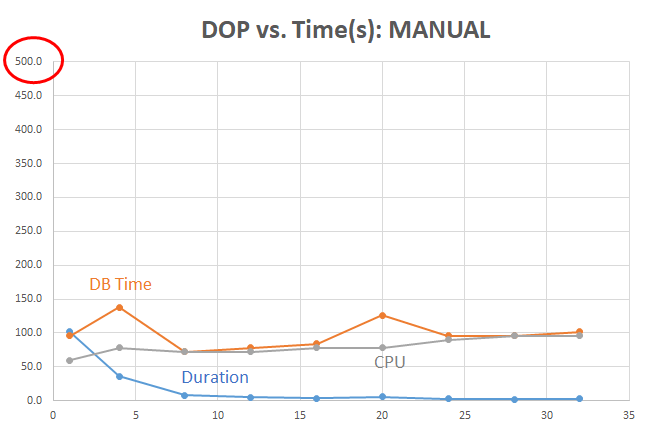
Note that the Y-axis in the AUTO tests ends at 2000 seconds, but the MANUAL tests ends at 500 seconds for readability. Even at lower DOPs, the duration (elapsed time) is a fraction of the time when we can avoid the TEMP tablespace and use PGA memory instead.
Even when the TEMP tablespace is out of the picture, the CPU use starts to rise gradually when each incremental increase in the number of allocated CPUs for a higher DOP costs more than it returns in reduced duration.
Exadata Bonus #1: HCC Benefits
All of the previous tests were run on the staging table with HCC QUERY HIGH. How much benefit did this provide to the test query? Here are the metrics for the non-HCC (NOCOMPRESS) table for when the duration was the same (8 seconds):
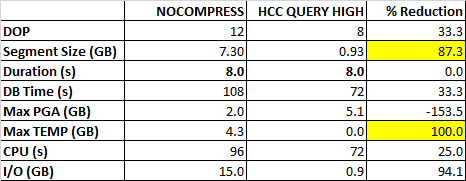
To get the same elapsed time for an uncompressed table, I had to run the query at DOP=12 instead of DOP=8. And the disk footprint at rest is about 7x higher. Only the PGA memory usage was higher with HCC, but using fewer parallel threads and no TEMP I/O. Zero.
Exadata Bonus #2: HCC in Flash
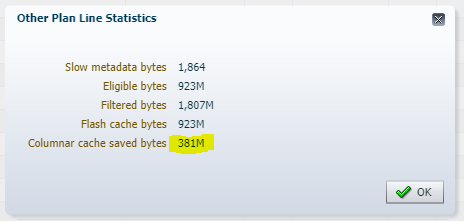
Flash memory at the storage level is getting smarter all the time — and the more efficiently tables are stored in flash, the faster it is to get it out. For most of these tests, the staging table was maintained in flash in a columnar format as well — and the execution statistics show how much more data was bypassed in flash due to the columnar format; this happens automatically!
Conclusions
Takeaways from this analysis:
- Although WORKAREA_SIZE_POLICY=AUTO is convenient, some of the memory-related parameters such as SORT_AREA_SIZE are not optimal for a DW or ETL environment.
- Even at high DOPs (32 or 64) with AUTO, the Oracle query engine still ends up using TEMP for sorting.
- The benefits of efficiently leveraging available RAM for the PGA are available on any Oracle Database, not just on Exadata.
- For the size of the table (72M rows) and the sort area size (1G), the optimal DOP is 8 (to avoid using any TEMP tablespace at all and get the best “bang for the buck” before diminishing returns sets in).
- PGA allocation is per parallel thread, therefore using a reasonably high DOP will mean that your sort operations can happen all in memory.
- The overall PGA usage is higher with MANUAL, but levels off at DOP=8
- Even with 5x more PGA used per session with MANUAL, the amount of time the PGA is needed for the session is no more than 1/5th of the time, typically even less.
- Exadata is more than just “icing on the cake”. Using HCC in read-only or write-infrequently scenarios pays for itself in reduced I/O, storage footprint, and as a result, elapsed time.
Next Steps
Still a few more unanswered questions and things to try.
- What happens when total PGA memory reaches PGA_AGGREGATE_LIMIT?
- Are there similar benefits for hash joins and bitmap index operations?
- Can TEMP be optimized further, even when TEMP segments reside in flash at the storage layer?
Stay tuned and may the engineered systems be with you!
