
I was testing a few of the functions identified in V$SQLFN_METADATA to see if some of the REGEXP-related functions were offloadable (they are!) and the query I used to exercise whether the function was actually offloaded revealed a couple of things that may affect how the Exadata cell servers work in conjunction with DML.
Testing Environment
The table I used to test was partitioned and had large VARCHAR2 columns that I needed to search using regular expressions to remove all whitespace then compare it to a string constant:
select /*+ monitor */ contact_id, contact_text
from cust_order_contacts
   partition (SYS_P622078)
where REGEXP_REPLACE (contact_text,'[^A-Za-z0-9]', '') = 'BobbyB';
I knew that none of the notes from the call center customer encounters would collapse to the string ‘BobbyB’, but that was the point — how little I/O I would return to the database layer would help me identify how much I/O and filtering from the WHERE clause happened at the storage cell level and thus how efficient offloading is and it would be clear that the REGEXP_REPLACE function was going to be evaluated in the cells.
The characteristics of the partition segment SYS_P622078 are as follows:
ROW_COUNT
----------
  35006670

PARTITION_NAME             BYTES     BLOCKS    EXTENTS
--------------- ---------------- ---------- ----------
SYS_P622078       64,088,965,120    7823360       1067
In this case the table partitions were not compressed using Advanced Compression or HCC; that will be a topic for a future post. These attributes will be relevant later when I’m trying to figure out the variation in offloading performance.
The first time I ran the query, the SQL Monitoring report showed something I wasn’t expecting:

I might expect offloading % to be a bit less than 100% on occasion, but an average I/O size of 986.7 KB? I was expecting something much closer to 1 MB reads. Running my test again about 10 minutes later:
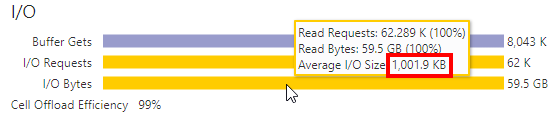
That’s much better — 1 MB reads. The reason for the change wasn’t chained or migrated rows, otherwise I’d get the same I/O size the second time too. Was it a RAC issue? Cell server load issue? I had to dig a bit deeper to find out.
Fortunately, after each query run I captured the session statistics from V$MYSTAT so I could compare the values, in particular, statistics related to cell server offloading.

The reduction in offloading (i.e., more work being done on the database server) can be attributed to one of three factors: delayed block cleanout, busier cell server CPUs, or cluster activity; the cluster activity would be highly correlated with how many UNDO records need to be examined, and those records might be in the SGA of another instance.
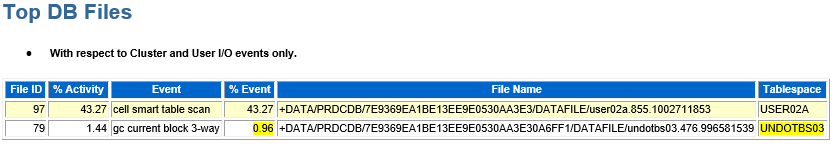
The historical ASH report for that query also points to a possible root cause in the “Top DB Files” section. One of the UNDO tablespaces was active during this query:
Looking at DBA_TAB_MODIFICATIONS, I see the recent DML to that partition, which I had originally thought only happened early morning:
PARTITION_NAME     INSERTS    UPDATES    DELETES TIMESTAMP
--------------- ---------- ---------- ---------- -------------------
SYS_P622078        2567506          0          0 2022-04-20 11:37:17
The next step would be to find a way to ensure a consistent timeframe in which delayed block cleanouts are “done” and avoid erratic query performance, exacerbated by Exadata’s offloading improvement factor.
Does It Matter?
Yes, there is an impact in performance — the delay and latency from one or more of the factors above. Looking at the total number of rows and the percentage of changes in this case, it didn’t affect performance that much, but what if almost all the rows in the partition had been updated in one transaction? At that point I’d consider “big data” alternatives to slow, row store and block-based transactions.
Conclusion
Offloading of the WHERE clause to the storage cells on Oracle Exadata is one of its hallmark features — but it can be affected by a number of factors, in this case, primarily unexpected recent DML! Sometimes you might have to look at the session statistics in V$MYSTAT or V$SESSTAT to find out what’s really happening. And don’t forget the venerable ASH report using historical samples from the AWR. SQL Monitoring reports are a necessity for my development and tuning efforts, but I sometimes need to dig a bit deeper to find out why the numbers don’t add up!
