
One of the key features of Oracle Database 23ai is creating multi-dimensional vectors and storing them alongside relational data in your tables. As I was investigating how vector datatypes were stored and accessed in an Oracle Exadata environment, I did a review of all the new vector-related functions and how to use them. The number of dimensions for a vector datatype can be up to 65,535, though trying to visualize distances for that many dimensions would require living or traveling in the multiverse.
Understanding how the VECTOR_NORM function works is straightforward in two or three dimensions but has more challenges when you start dealing with four or more dimensions. Given that Oracle Database 23ai is all about … AI, I thought I could use ChatGPT to help me with some visualizations.
VECTOR_NORM usage
The “NORM” in VECTOR_NORM means “normalize”, as in Euclidean distance or magnitude. The VECTOR_NORM function takes a vector (any number of dimensions in any format) and calculates the length of that vector from the origin, which is VECTOR('[0,0]') in a 2-dimensional space, VECTOR('[0,0,0]') in a 3-dimensional space, and so forth.
Visualizing how vector math works using a graph of the vector coordinates helps understand the concepts and even the math behind it. For 2-D through 5-D, I enlisted the help of ChatGPT to create a few graphs.
2-D
Starting with two dimensions, the function call looked like this:
select vector_norm(to_vector('[3,4]',2,float32));

VECTOR_NORM(TO_VECTOR('[3,4]',2,FLOAT32))
-----------------------------------------
                                 5.0E+000
The Euclidean distance to [0,0] is sqrt((power(3,2)+power(4,2))) = 5. ChatGPT rendered this in a straightforward X-Y chart.

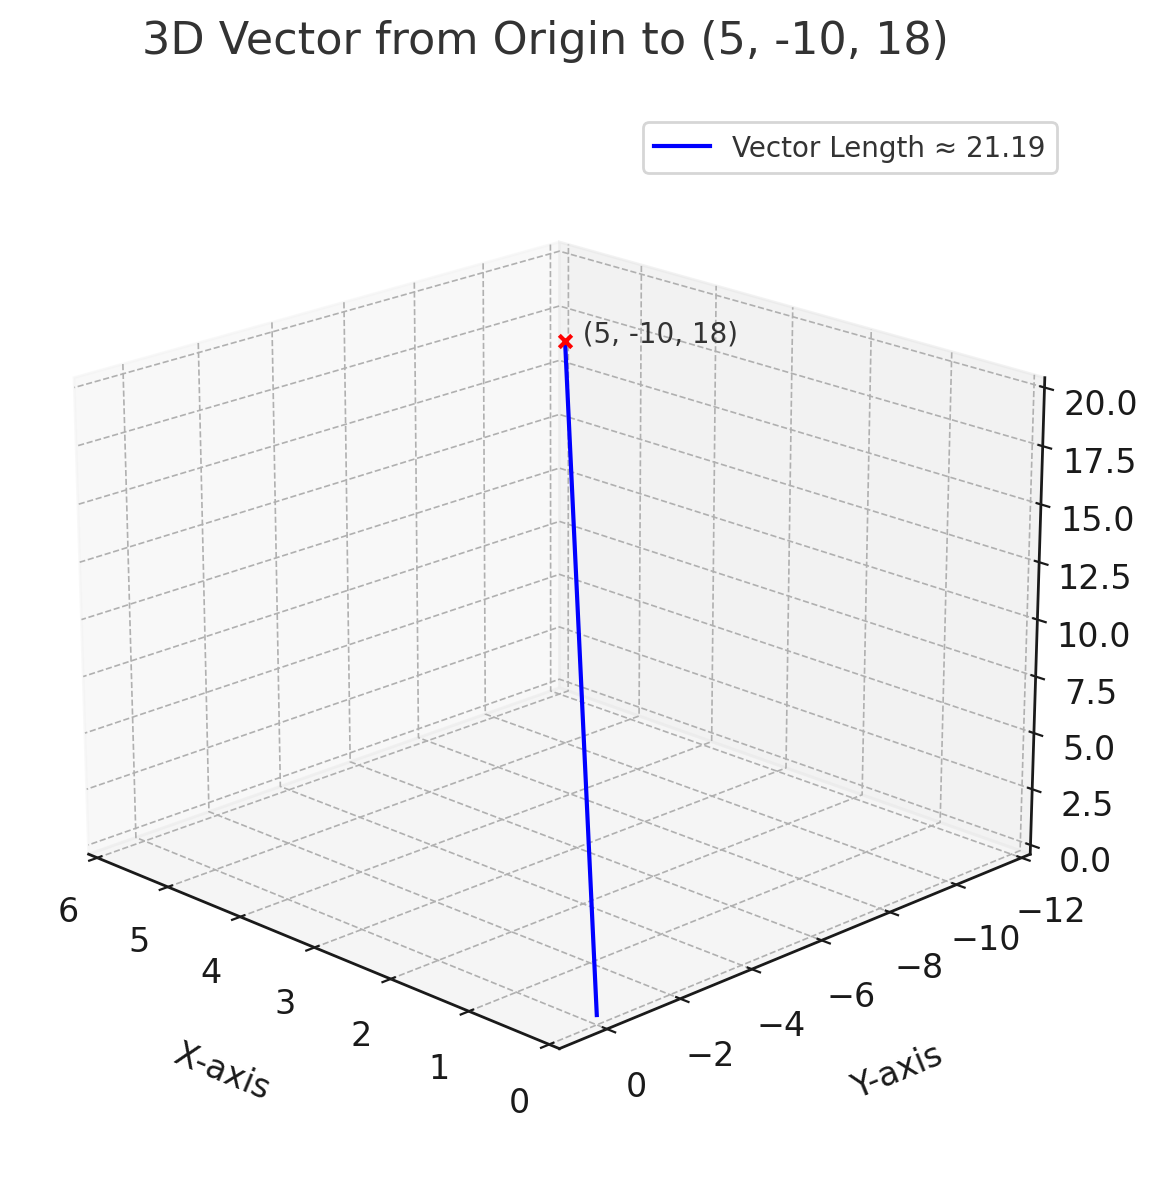
3-D
It’s not too hard to generate a 3-D image in a 2-D space, and living in three dimensions makes it easy to understand too. The next call to VECTOR_NORM is as follows:
select vector_norm(to_vector('[5,-10,18]',3,float32));

VECTOR_NORM(TO_VECTOR('[5,-10,18]',3,FLOAT32))
----------------------------------------------
                                    2.119E+001
The result is a vector length of about 21.19. ChatGPT did a reasonable job of rendering this in 3-D, though it couldn’t seem to keep the Z-axis label visible no matter how hard I tried.
4-D
When I asked ChatGPT about visualizing a normalized vector length for a vector with four dimensions, it pointed out the limitations of displaying it in a 2-D chart, but it gave me a few options. For this VECTOR_NORM calculation:
select vector_norm(to_vector('[26,-10,18,-20]',4,float32));

VECTOR_NORM(TO_VECTOR('[26,-10,18,-20]',4,FLOAT32))
---------------------------------------------------
                                         3.873E+001
With a result of 38.73, one of the options that ChatGPT provided was a color-coded W-axis, and it was able to label the Z-axis this time.
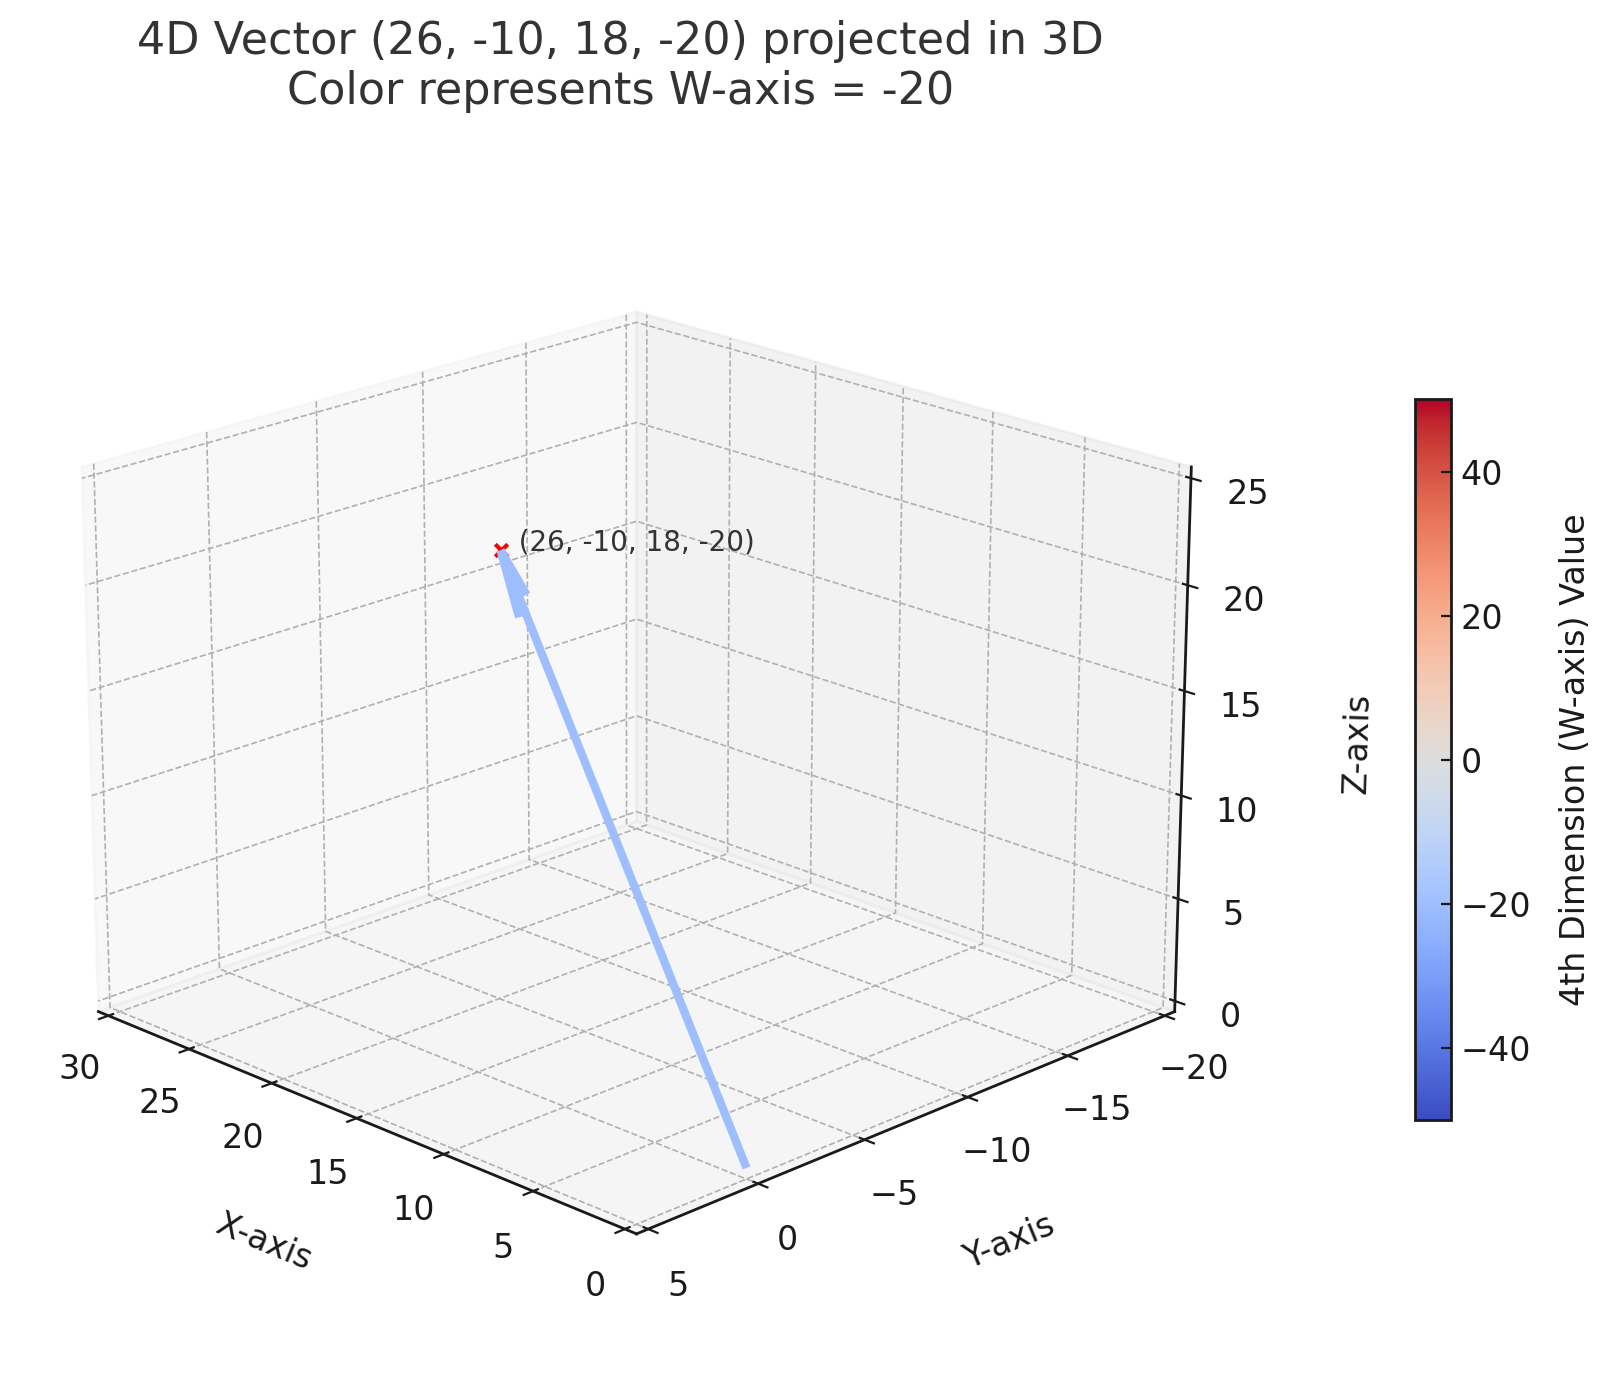
While it neglected to put the result of the function on the graph itself, the length of the line does appear to be close to 38.73.
5-D
At 5-D, ChatGPT was able to add another dimension using a different color with the width of that color as the V-axis.
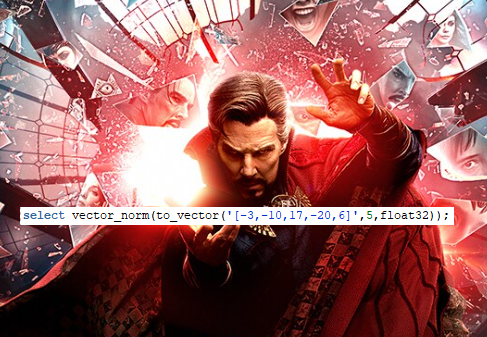
select vector_norm(to_vector('[-3,-10,17,-20,6]',5,float32));

VECTOR_NORM(TO_VECTOR('[-3,-10,17,-20,6]',5,FLOAT32))
-----------------------------------------------------
                                           2.888E+001
This time, ChatGPT lost the Z-axis label again, but did include the result of the function: 28.88.
6-D and Beyond
The visualizations starting at 6-D were essentially ways to divide up the charts into subsets of dimensions. Most of them didn’t add much to my understanding, but I didn’t even expect 5-D to be as useful as it was!
Conclusions
Vectors in Oracle Database 23ai were not specifically meant to represent physical space in the real world, but graphs (generated manually or by a tool such as ChatGPT) makes understanding how vectors work in 2-D and 3-D space easier. At the end of the day, having up to 65,535 dimensions in a vector facilitates creating attributes of an object that can be compared to other vectors in the same model from a similarity or distance perspective. It elevates the concept of a relational database model to what I like to call a “hyper-dimensional” database model, logically a blizzard database model instead of a snowflake database model!

